9.05.2026
Thermography in Mechbase: Automated Hotspot Detection and Classification
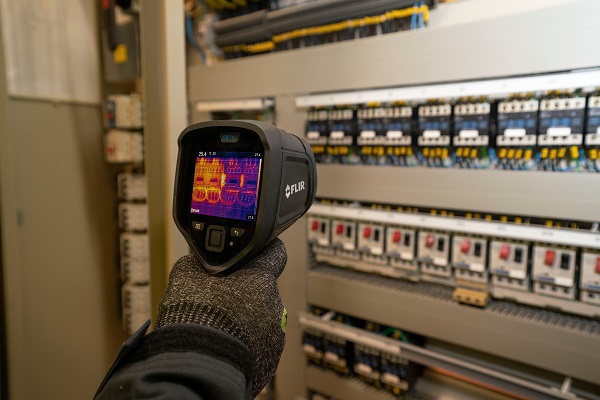
Thermal inspections generate two things: useful data and a fair amount of manual work after the fact. The thermographer captures the images, opens the camera software, reads the temperatures, classifies the findings, and then enters everything into the maintenance system. It works, but the step between the camera and the logged finding is repetitive and prone to transcription errors — and the images usually end up in a folder nobody opens again.
Mechbase now handles that step. Upload a FLIR thermal image to an IR measurement point and the system reads the radiometric data embedded in the file, detects hotspot clusters, classifies their severity against NETA MTS Table 100.18, and renders the results as an interactive overlay directly on the image. No intermediate software, no manual transcription.
How Hotspot Detection Works
The detection uses hysteresis thresholding rather than a fixed temperature cutoff. A strong threshold seeds the hotspot candidates; a weak threshold expands each one to capture adjacent elevated pixels that belong to the same source. Connected components are labeled and ranked. The ambient baseline comes from the image itself — the 20th percentile of the frame — so the sensitivity adapts to the actual scene rather than constants set in the field.
What this produces in practice are coherent clusters instead of scattered hot pixels. A motor terminal box, a loose connection, and a warm busbar each become their own finding. The method mirrors how a trained thermographer would circle anomalies on the image rather than flag everything above a threshold.
NETA MTS Classification
Each detected cluster is classified by its temperature rise (ΔT) relative to a reference component under similar load, per NETA MTS Table 100.18:
| Status | ΔT above reference | What it typically means | Recommended action |
|---|---|---|---|
| Good | 1 – 10 °C | Localized heating; no immediate concern | Document; re-inspect at next scheduled interval |
| Minor | 11 – 20 °C | Developing deficiency | Plan repair at next available window |
| Major | > 20 °C | Significant deficiency | Prioritize repair; escalate for critical equipment |
The measurement point’s overall status reflects the worst cluster across all attached thermograms. That status rolls up into the existing asset health view and alarm pipeline — the same one that governs vibration and pressure measurements.
Multiple Images Per Measurement
A single inspection often produces more than one image: different angles of a motor terminal box, the three phases of a switchgear compartment, a before-and-after comparison after a corrective action. All of them belong to the same measurement point. Mechbase processes each file independently and aggregates the results — worst severity wins for the status, temperatures combine for the trend chart value.
The Overlay
Detected hotspots appear as color-coded dots on the thermal image: yellow for Minor, red for Major. The overlay is visible on the thumbnail in the measurement list and carries through to the full-resolution lightbox. Hovering a dot shows peak temperature and ΔT. When a measurement has several thermograms, they display in a grid, each with its own overlay.
The intent is straightforward: open the measurement after uploading and see immediately what the system found, without switching to external software.
No Changes to Your Route
For teams already running IR inspection routes in Mechbase, there is nothing new to configure. Upload FLIR images where you would previously have typed a manual temperature reading. Alarm evaluation, status roll-up, and work order triggers all follow automatically. The feature removes the manual classification step; everything else stays the same.
Doing IR inspections and want to see this on your own thermograms? Contact us